Tutorial presentation

Detailed report


This website presents consolidated metrics of IPv6 adoption, globally and at country level. When existing data are publicly available we've used them. When nothings was readily available or was not satisfactory, we’ve build programs to gather complementary statistics.

Summary


Method & Explanations

  • Color: describes what the color of a country represents on the map (= first line of legend)
  • Indication: describes what the (eventual) other lines of legend could mean but has no influence on country color


Overall data (map "all")

Updated: 24 June 2013

The overall map presents two IPv6 metrics: the overall deployment ratio and the relative deployment index. The former is an average of other metrics and is used to measure the deployment of IPv6 in a scale between 0% (no IPv6 at all) and 100% (everything is IPv6). The purpose of the latter is to compare countries to the currently most advanced IPv6 deployment (which country is graded 10). The color on the world map is based on this index


The overall IPv6 deployment ratio depends on three metrics: IPv6-enabled transit AS, IPv6 content and IPv6 users. How these ratios are computed is described in the sections below. The readiness of the country's infrastructure is described by the ratio of IPv6-enabled transit AS and amounts to 25%. The last 75% of the final ratio are allocated to the geometric mean between the content and the users. Considering that the product of users and content available to these users gives a simple estimation of the actual IPv6 traffic in the country, a geometric mean between content and user ratios is more meaningful than an arithmetic one. A much greater weight of 3 against 1 is explained by the fact that transit AS ratio only represents infrastructures whereas everything else needs to be working for user traffic to exist.


The relative index uses the same arithmetic mean but with each term divided by their maximum value around the world. This mean may be used to compare several countries and is normalized afterwards from 0 to 10. In this way the best IPv6 country gets an index of 10 out of 10 and countries with very few IPv6 transit AS and users get low index values.

Map information:

  • Color: Relative Index
  • Indication: values for all indicators


IPv6 Prefixes

When an entity plans to enable IPv6 on its network, the first step is to ask the RIR for an IPv6 prefix.
The second step is to make this prefix reachable on the network, which means make an entry in BGP tables for this prefix: the prefix is then routable.

Then we can measure activity on this prefix, according to APNIC Labs data based on ads and Eric Vyncke's data based on torrents. If we've seen traffic from one of those two sources then we assume that the prefix is alive.

  • Color: Ratio of allocated v6 prefixes that are routable to all allocated v6 prefixes
  • Indication: Ratio of allocated v6 prefixes to allocated v4 prefixes
    Ratio of allocated IPv6 prefixes from which traffic has been seen to all allocated v6 prefixes

Source: Whois from RIPE, ARIN, APNIC, AFRINIC, LACNIC
APNIC labs, Eric Vyncke


Transit AS

To measure the level of IPv6 readiness of the core of the internet, from a local and global point of view, one good way is to analyze the BGP routing table and measure the IPv6 enablement of Transit ASs.

A Transit AS is an AS through which packets travel and which is neither the departure nor the destination.
From a more pragmatic point of view: all AS that appear on an AS path of BGP table (and that are not the origin AS or the destination) are considered Transit AS

  • Color: Weighted ratio of AS that are Transit V6 to AS that are transit V4 (IPv6 Transit AS).
  • Indication: Weighted ratio of transit AS V4 that are V6 enabled to transit AS V4 (IPv6 enabled Transit AS).

More precisely

  • IPv6 Transit AS: an AS that is Transit (gives Transit service to another AS) on both IPv6 and IPv4 networks.
  • IPv6 enabled Transit AS: an AS that is transit on IPv4 network and has an IPv6 prefix but is not necessarily Transit on IPv6 network.

The weight of an AS is the number of connexion it has on both IPv4 and IPv6 networks.

It is calculated as follows:


Source: Routeviews for BGP table.
Team-cymru for AS names and countries.


Content

The next step is to enable content on a web server. Alexa ranks websites by pageviews and unique users per country. It is therefore possible to retrieve the Top-50 websites per country.
For each of those websites, an AAAA request is made to DNS servers for the exact domain name and also possible test names such as www6.mydomain.mytld or ipv6.mydomain.mytld.
For each AAAA record test if the webpage is working in IPv6.

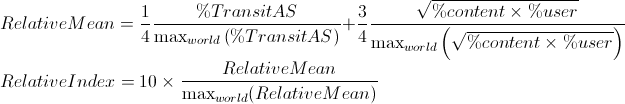
  • Color: Weighted ratio of IPv6 enabled websites
  • Indication: Weighted ratio of IPv6:
    • in test: test domain name working in IPv6
    • failing: AAAA record exists but webpage not working in IPv6
    • other: not IPv6 enabled websites
The weight is calculated as follows:


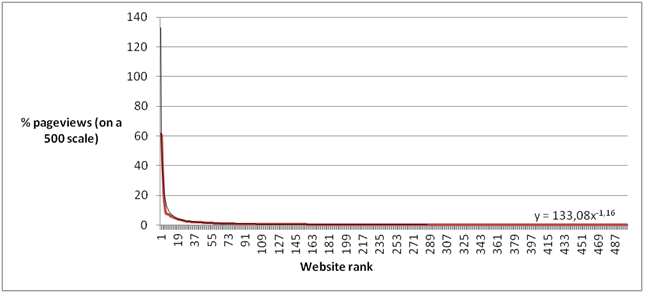
This is an approximation f where pageviews = f (website rank) based on world data. Therefore the weight of a website X is the probability for a random user in a random country on a random webpage, that this webpage belongs to X. Sadly it is unable to extract from Alexa specific country data about pageviews.

Source: Alexa for websites rankings per country.
DNS servers: OVH, Google, Cisco.


Users

Map: Data that represents IPv6 preferred users:

  • Color: Google search IPv6 preferred data as described here
  • Indication: APNIC Labs data calculated as described here

Tree Map: Other representation of IPv6 users by RIR (left click to go further in the tree, right click to go back):

  • Size: Estimated number of Ipv6 users
  • Color: % of IPv6 users ('Color' of Map)


Cisco 6lab IPv6 stats widget

You can put one of these widgets to link the https://6labs.cisco.com/stats from your site.

The picture in the widgets will reflect the state of the IPv6 in the countries of your choice that you can supply (up to 5) as part of the widget's URL. If you prefer to serve the widget from your own site to increase the responsiveness, you are welcome to do so. The picture changes every 24 hours, so you can fetch the image once a day and serve from your own server. Please randomize the time when you fetch the widget so that the different requests would not pile up at the same time.


The sample HTML code to display the stats of USA, Japan, France, India and China with hotlink is as follows:

Version 1
<a href="https://6lab.cisco.com/stats/"> <img src="https://6lab-stats.com/v1.php/usjpfrincn" alt="Cisco 6lab IPv6 stats widget" width="220" height="430"/> </a>
Version 2
<a href="https://6lab.cisco.com/stats/"> <img src="https://6lab-stats.com/v2.php/usjpfrincn" alt="Cisco 6lab IPv6 stats widget" width="220" height="448"/> </a>


Sources:

  • Whois db from RIPE, ARIN, APNIC, AFRINIC, LACNIC
  • http://labs.apnic.net/dists/v6dcc.html
  • https://www.vyncke.org/ipv6status/prefixes.php
  • http://archive.routeviews.org/
  • https://www.team-cymru.org/Services/ip-to-asn.html
  • http://www.alexa.com/topsites/countries
  • https://www.google.com/ipv6/statistics.html#tab=per-country-ipv6-adoption
  • http://www.itu.int/ITU-D/ICTEYE/Indicators/Indicators.aspx